Whereas one focus of week 8 was working with LightSide, basic information about the following steps of text mining was provided in this week’s videos (s. https://www.youtube.com/user/dalmooc). We had some reflection tasks, hands-on-experimentation, assignments and group tasks this week – I made the choice to note the main aspects of week 8 and also to do something in LightSide in order go get some practice with it.
1. Text Mining: Data Preparation
As the process of preparing data for data mining / text mining can be very complex and requires a lot of time and thought, you should think at the beginning if it is realistic to achieve and if it is worth doing (e.g. when you can use the trained model for other studies where similar data is collected etc.).
1.1 Cleaning text
It would be nice to have raw data already in a tablular form or at least already in structured form (xml, json, sql) and so being able to use plugins / programming language to get it in a tabular form. In addtion, it can be necessary to aggregate data first because not every entry should be a unit in the dataset for machine learning (perhaps might be done in Excel with some macros). Things like reformatting because of non standard character encoding (UTF-8 would be good, LightSide can handle that format), disfluencies (perfectly formed English in data is unrealistic when doing learning analytics) or text which is in another language (LightSide is configured for English) might need attention and additional software plugins.
1.2 Annotating data
„Training a predictive model requires annotated training data“ – a set of 1000 instances of labeled data is a good start: 200 as development data, 700 for cross-validation and 100 as final test set. A dataset example which results out of a simple poll already has a label given by the poll (yes/no), but otherwise you would have to think about what you would like to detect in student interaction. Maybe there is already a coding manual of the codes you are interested in.
2. Text Mining: Getting a Sense of Data
The step „getting sense into data“ is a step in the data mining process that many people don’t spend enough time doing and which gets better with own experience and reading linguistic books. The qualitative analysis is an important „precursor to predictive modeling“.
Regarding sentiment analysis, it’s more complicated than reading text, counting positive and negative words (individual words are not enough): context matters, rhetorical strategies may appear, sentiment might be expressed indirectly
3. Text Mining: Basic Feature Extraction with LightSide
Feature extraction is about thinking what we would like to include in the model, what will correlate with what we’re trying to predict.
A noisy predictor of class value would be a term which can be used in different meanings and might therefore for some might mean agreement and for others might mean disagreement with something (like in our Healthcare poll example „cost for one person“ or „cost for society as a whole“ – More context would be needed to be sure of the meaning).
LightSide provides very easy access to a broad range of simple low-level text features.
In LightSide, the panel „Extract Features“ would automatically check off the text field to extract features from – but if you’ve got other variables in other columns of the dataset, in the menu „Feature Extractor Plugins“ besides „Basic Features“ the option „Column Features“ should be checked off also.
In „Configure Basic features“ you have to choose among Unigrams (=Individual words), Bigrams, Trigrams, POS Bigrams (= Part of Speech Bigrams), POS Trigrams, Word/POS Pairs, Line Length, Count occurences, Include Punctuation, Stem N-Grams, and other options (handling of stopwords etc.).
Unigrams are an easy way to try to grab the content of a sentence, but you loose the context and structure of the sentence. With bigrams, there is a already a little bit of ability to disambiguate. With using a combination of unigrams and bigrams the feature space gets much larger which leads to a higher possibility of overfitting – adding richer features gives you more information but comes with a cost.
Another idea is to think about words in terms of grammatical categories, in parts of speech (noun, preposition, verb…): which parts of speech tags occur next to each other? There are standard tag sets for „Part of Speech Tagging“ which can be used.
Line length just counts the number of words in a text and could be meaningful dependent on the kind of text.
Stopwords are often removed in text classification (one of the things which come from information retrieval) – but in text chat it would be the other way round: „contains non-stopwords“ would be interesting.
Features like N-Grams, Part of Speech Bigrams and Word/POS pairs were described as being binary features (true/false), but another way would be thinking about them as count features – that happens if you check off „Count Occurences“ – then they aren’t binary encoded any more.
You have to decide if you want punctuation as part of your feature space or not: Sometimes it just adds noise – not everybody uses it and some use it inconsistently (Yes, that would be me, when writing in a foreign language and thinking about difficult concepts… punctuation isn’t a priority).
Another decision is: Do you want to use stemming or not? Stemming removes the endings from various forms of a word and makes the feature space a little more compact.
These selections interact with eath other and so part of speech tagging is done first (before stemming or stopword removal).
4. Text Mining: Interpretation of Feature Weights
This starts when the model is already built. LightSide has a panel „Explore Results“ (normally used for error analysis) with which you also can look at feature weights. In the confusion matrix (called „Cell highlights“) you can select „feature weight“.
Words that are negative should have a large negative weight when you selected negative data & positive prediction in the confusion matrix (for example „bad“ = -0.8231) At the bottom of the LightSide interface you can choose the Extractor plugin „Documents display“ and check off „Filter documents by selected feature“ and „Documents from selected cell only“ in order to see where in the original text the words occur.
5. Text Mining: Comparing Performance of Alternative Models
In LightSide, you can compare different models by using the panel „Compare Models“. If you want to compare two models with a different feature space (one with Unigrams and one with Unigrams and Bigrams) for a specific text, with the option „Comparison Plugin = Basic Model Comparison“ you can see the performance values and confusion matrixes in one screen. If you switch to the LightSide option „Difference Matrix“, you can look at misclassifications in the text context.
6. Text Mining: Advanced Feature Extraction
„Advanced features enrich the feature space, but expand the size of the feature space – large feature spaces mean added risk of overfitting“
I’d like to keep this short, because as a beginner, I’ll stay with the simpler things at first (= LightSide’s „Basic Features“ in the Feature Extractor Plugin).
Advanced options would be: Stretchy Patterns (for context around a word: definition of pattern legth, gap length and using categories – there are some predefined categories in the Lightside Toolkit Folder), Regular Expressions (help available in LightSide), Character N-Grams (for spelling modifications, consistent endings,..), Parse Features (slow, produces a huge number of features, seldom used).
7. Text Mining: Working with LighSide
I did a lot of things in LightSide: Extracting features, building and comparing models, inspecting models and interpreting weights… I’m optimistic, that I understood the technical part of how to do this and that I got an impression of the process and that’s about it.
My results with LightSide are in this attached pdf file:
w8-assignment-ID.pdf
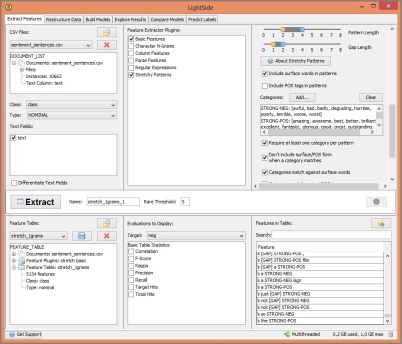
(screenshot from my pdf)