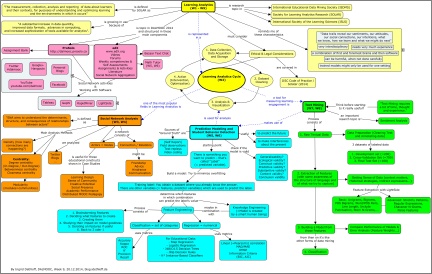
Learning Analytics MOOC – Week 7 – Text Mining Introduction

The Google Hangout of week 7 was as interesting as ever (and for me again the archived version). At this time of the MOOC it’s no surprise for me, that Carolyn and George emphasized that analytics isn’t easy (I think we all felt that in this course as well) and that handling the specialized software is even the easy part of the process. What I understand completely by now is that learning analytics is very interdisciplinary – right now we have got computer linguistics in the mixture. At Heidelberg University we have got an „Institut für Computer-Linguistik“ – it might be interesting for me to contact them about elearning & analytics some time in the future.

As I worked on this week’s blog post for some days, it got longer and longer and therefore I divided the article in three sections. One section is about saying thank you for a great learning experience although we’ve still got two more weeks  – but who knows, with christmas preparations and further demanding tasks in text mining ahead, if I find the time later on 😉

1.) Some thoughts about the DALMOOC structure
My observation regarding the course structure is that the segments of the MOOC are kind of independent (I think you really could do the cMOOC thing and pick just one topic and engage with it) and on the other hand I see the full picture by now and why these parts were chosen by the instructors and how they fit together very well. I think it is extremely difficult to design a good MOOC for everyone – for experienced learners in the chosen topic as well as for beginners – and to reduce a topic (which you normally would spend a semester on as Ryan said) to a few weeks, combine different teachers and do this on a high level of including current research. Great job so far!
In addition to the discussion forums on edX, the Google Hangouts provided an important element of continuity, live feeling and caring – It would be interesting to know, how much time the facilitators spend each day with the MOOC… Twitter in its way was also motivating to get in contact with fellow students and helped me to stay on-board – so thanks a lot for favs and retweets!
In the beginning I had two goals: to learn something about learning ananlytics and to have a closer look at the dual structure of the MOOC. I had to reduce my second goal due to limited time and getting more engaged in the content part than I had planned / expected. So my parallel visits to ProSolo weren’t as frequent as hoped, but I experienced the different structure of initially the same weekly resources. It has much charm, but I returned to edX for my learning because I know (and like) the edX interface very well from former MOOCs and from my professional job. Until now, I even stayed away from Bazaar, because after the first weeks the course content was so new and difficult for me, that I had the impression that I wouldn’t be able to contribute in time something meaningful via a synchronous text chat channel, in a foreign language and where I maybe would be paired with someone who expects a meaningful discussion on a higher level than I could offer. But that’s a very personal assessment, I’m sure that others saw it in a totally different way. In a MOOC – and especially this one – there are so many different possibilities and learning pathways that you have to choose a combination you are happy with (and I’m happy with mine). I have stopped counting the many hours I spent on the MOOC each week and I’m fully aware that this is an exception which I can’t do often. A similar very valuable demanding MOOC for me was Nellie Deutsch’s (first) „Moodle MOOC on WizIQ“ in June 2013, where (besides blogging and taking part in many forum discussions) I created a lot of digital artifacts in the 4 week course duration. In comparison, the HarvardX Justice MOOC in 2014 was „easy“ for me because of the very plannable amounts of time: It was possible with about 4 hours a week to get a very good learning experience with the consistent (and definitely not boring) video, self-test/quiz and poll structure, the exam at the end and even without any live sessions – reflections about the topic included.

2.) Text mining methods as part of data mining – overview of the process of building and evaluation a model
An example of „collaborative learning process analysis“ illuminated that a theory driven approach (from the fields of psychology, sociolinguistics and language technologies) is considered to be more effective than shallow approaches to the analysis of discussion data: If you build models from an understanding of these theories, the models will be more effective.

(Accidentally) overfitting is always a risk, so you have to gain awareness of the important methodological issues for avoiding it – overfitting is „where you build a model that’s really too particular to the data that you have trained it on, in such a way that you don’t get good generalization to new data that you want to apply your model to“. Keep the data you train on and the data you test on separate, but it’s good when the data set you train the models on is representative of the data you later test on.

The text mining process in simple form consists of:

  • Raw textual data ->
  • Extraction of Features (with some awareness of the structure of language and of what we try to capture)  ->
  • Building a Model from those features  (From then on it’s like other kinds of data mining)  ->
  • Classification

A lot of work in text mining is „representation„: „You have to know what it is about the data that you want to preserve so those instances that should be classified the same look similar –  and those instances that should be classified differently look differently.“ Three sets of data are recommended: A development/exploration set, an evaluation/cross-validation set (for training and testing) and a final test set.
A starting point is qualitative analysis and setting aside data for development (which you don’t use later on for training and testing!) and looking for examples from each of the categories you want your model to distinguish between – then you have to think about how to extract those features from the raw text (in order to build these vectors of features that you can apply a machine learning algorithm to). You’ll extract those features from your cross-validation data and do a cross-validation to evaluate how well that model is doing. Usually it is not good enough at the first round, so you do an error analysis: You train the model on your cross-validation data, apply it to your development data and look at where the errors are occuring on the development data. With a new set of features you cross-validate in your cross-validation set, e.g. you work iteratively on your model and try to improve it and test/compare the performance on the cross-validation set.

  • The development set is for: Qualitative analysis before machine learning + error analysis + ideas for design of new features
  • The cross-validation set is for: evaluation your performance

When you think you are done, you apply that model to the final test set. The whole process is a partnership between the developer (brains) and the algorithms (software).

3.) Sentiment analysis and my thoughts about the risks of learning analytics
One of this week’s videos was about a study about the application of sentiment analysis to MOOC discussion forum data – regarding expressed sentiment and exposure to sentiment. A set of four different independent variables was used in the survival model: The individual positivity, the individual negativity, the thread level positivity, the thread level negativity – the dependent variable was „dropout“.
It was very convincing for me to hear that it’s much more complicated to really get to what a student’s attitude towards a course is than merely counting the number of positive or negative words (and a machine learning model might not be able to do it) – we have to look below the surface level analysis of text. Students might simply be discussing intensively using negative terms while on the other hand being very engaged. Or they might be discussing topics in which appear „negative“ words. It doesn’t mean automatically that they have a negative attitude towards the course or a negative experience with it. So „simplistic ideas of sentiment predicting droput are not supported“.
(s. http://educationaldatamining.org/EDM2014/uploads/procs2014/long%20papers/130_EDM-2014-Full.pdf)

I think, that it is a nice example which shows some of the difficulties with learning analytics in other situations (obviously I don’t criticize the above study): You apply LA from a worthy starting point and it seems to be so simple, but just it is not and you could even do harm if you don’t do it carefully and don’t know what you’re doing. I think, that a lot of people who talk about Learning Analytics don’t really know what they are talking about but might have a strong opinion for or against it – it might be another one of those topics in elearning where people think they know it all… In addition, specialized software for those persons could mislead to the wrong assumption, that such software results couldn’t be wrong, would be impartial and even easily transferrable to other educational settings…  In times, when cost reduction and measurements are esteemed, scenarios with monitoring student and staff performance out of „business“ reasons (and not really for improvement of teaching & studying) for me don’t seem to be too unrealistic. Yesterday I saw an article on Mashable which clearly said that even business analytics isn’t easy (http://mashable.com/2014/12/05/analytics/?utm_cid=mash-com-Tw-main-link) – and in an educational context analytics is even far more complicated.

„Code of practice for learning analytics : A literature review of the ethical and legal issues“ (Niall Sclater)
http://analytics.jiscinvolve.org/wp/2014/12/04/jisc-releases-report-on-ethical-and-legal-challenges-of-learning-analytics/ I think this resource from JISC (which I saw thanks to a retweet from Dragan) is a very important one and hopefully I’ll find the time to have a closer look.

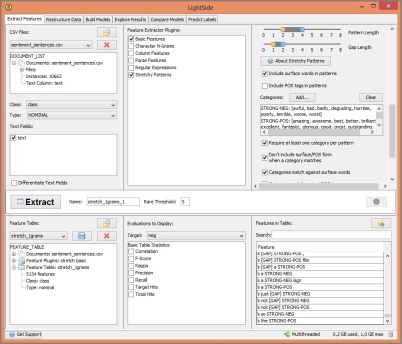
I look forward to week 8 and some more insights in text mining. In week 7 I did the LightSide task with the prepared csv files (and got the correct result), read the LightSide manual  with all these definitions of terms/acronyms I’ve never heard of before (e.g. unigram = A unigram feature marks the presence or absence of a single word within a text) and could understand that Lightside „is divided into a series of six tabs following the entire process of machine learning“.


Learning Analytics MOOC – Week 6 – Behavior Detection and Model Assessment

Hamburg 2014

After a much-needed and long-planned break because of a sightseeing weekend in Hamburg, it’s back to DALMOOC and a look back on week 6. Thanks to Ryan’s comments/solution about the problematic „logistic regression“ question, I went on with the math tutor assignment of week 5 and was able to finish it before going to Hamburg. Week 6 has another one of those external resource math tutor things… and I haven’t completed it yet: Questions 1 to 4 were doable with Excel, but for Question 5, I haven’t got an idea how to start (maybe some time later).

Week 6 seemed a little bit easier to understand than week 5 because of the videos which explained some of the topics of week 5. However, I can’t describe the topics of week 6 in detail although I spent many hours with the 8 videos. So for now, it’s just the overview of main aspects.

For me, MOOCs which go on for longer than 4-6 weeks, are hard to manage because I would like to have some leisure time again… In my opinion, you have to be very motivated to stay on a MOOC with semester-like duration – either you really need the content / certificate or otherwise you do it because you like it very much. One of my main MOOC incentives are lecturers / facilitators who really care for what they are doing and really have something to say – like in this MOOC.

There’s no perfect way to get indicators of student behavior that you can completely trust. It’s not truth, it’s ground truth“ – that sums it up pretty well. Sources of Ground Truth are self-report (although not common for labeling behavior), field observations, text replays and video coding.

In week 6 we heard about Feature Engineering, which „is the art of creating predictor variables“ and the „least well-studied but most important part for developing prediction models which otherwise won’t be any good“. For that you can consider papers from other researchers (there’s a lot of literature about features which were used and worked or didn’t work) and take a set of pre-existing variables (this is faster), but thinking about your variables is likely to lead to better models. These steps  would be 1) Process of brainstorming features 2) Deciding what features to create 3) Creating them 4) Studying their impact on model goodness 5) Iterating on features if useful and 6) Going back to step 3 or 1

A big part of week 6 was about metrics for classifiers: Accurary, Kappa (I’ll keep in mind that for data mined models, typically a Kappa 0.3-0.5 is considered „good enough to call the model better than chance and publishable“), ROC (= Receiver-Operating Characteristic Curve), A‘, Precision and Recall. For each of these we got additional information, formulas, examples and details which might come in handy in the future.
The metrics for regressors include Linear correlation (= Pearson’s correlation), MAD/MAE (= Mean Absolute Deviation/Error), RMSE (= Root Mean Squared Error) and Information Criteria like BiC (Bayesian Information Citeria) and AIC.
Which metrics to use?
There is a saying that the idea of looking for a single best measure to choose between classifiers is wrong-headed and you could say the same for regressors. Advice: Try to understand your model across multiple dimensions and that involves using multiple metrics.

Another aspect of week 6 was Knowledge Engineering (= rational modeling, cognitive modeling). Knowledge Engineering is where your model is created by a smart human being (not a computer as a data-mined model) who is carefully studying the data and becomes deeply familiar with the target construct and understands the relevant theory and how it applies. Knowledge Engineering can even achieve higher construct validity than data mining. A good example is Aleven’s model of students‘ help-seeking. On the other hand, unfortunately, there are cases where people didn’t do it carefully in order to just get a quick result – this has a negative influence on science and maybe even student outcomes because of wrong interventions. It is hard to know if the knowledge engineering was done very good, because the work is in the researcher’s brain and the process usually invisible; it is easier to tell with data mining models.
Feature Engineering is very closely related to Knowledge Engineering, it’s not an either-or.

There are many types of validity and it is important to address them all: Generalizability (= Does your model remain predictive when used in a new data set?) / Ecological validity (= Do your findings apply to real-life-situations outside of research settings?) / Construct validity (= Does your model actually measure what it was intended to measure?) / Predictive validity (= Does your model predict not just the present but the future as well?) / Substantive validiy (= Do your results matter? Are you modelling a construct that matters?) / Content validity (= Does the test cover the full domain it is meant to cover?) / Conclusion validity (= Are your conclusions justified based on the evidence?)

The videos for week 6 can be found in https://www.youtube.com/user/dalmooc and as MOOT (Massive Online Open Textbook) „Big Data and Education“ on Ryan Baker’s website: http://www.columbia.edu/~rsb2162/bigdataeducation.html

That’s it for week 6, and  we are already in week 7 with the topic „Text Mining“. The Google Hangout of week 7 is on Thursday 2 a.m. local time – so, again, it will be the archived version. Sadly one disadvantage of an international MOOC – on the other hand, I enjoy immensely the diversity and internationality of the students 🙂

Learning Analytics MOOC- Week 5 – Prediction Modeling

Definitely not for beginners in the field of analytics. That was my first impression of week 5 and still is my impression. The videos were way too fast for me in speaking and content, but nevertheless, I’ll try to note what I got out of them, hopefully it’s correct. In this blog post I’ll also cover my experiences with the „week 5 activity“.

What’s the use of prediction modeling? Sometimes to predict the future, sometimes to make interferences about the present. There could be automated decisions by software or informing teachers so that they can do something. Starting point: There is something you want to predict – that’s called „Label“ (= predicted variable).

a) Regression = numerical (how much of a video a student will watch, what will be the student’s score,…)
In order to build a model, you obtain a dataset where you already know the answer (= training label). There are other variables (= features, predictor variables) which are used to predict the label. Regression means that you determine which features in which combination can predict the label’s value. In order to interpret the weight of the features, transformation is necessary.
One way of regression is linear regression (often more accurate than complex models particularly when you cross-validate). Another kind of regression would be regression trees (either with linear equations at each of the leaves of the tree or as non-linear regression trees).

b) Classification = set of categories (correct/wrong, will drop out/won’t drop out,…)
You get the labels from survey data, field observations, school records etc. With each label there are some features, which could be used to predict the label. A classifier is to determine which features in which combination can predict the label. Software like RapidMiner, Weka etc. have a lot of classification algorithms, but is is hard to say which work best in a certain context. Educational data has lots of systematic noise, so the advice is to use conservative classifiers and find simple models. From experience, considered as not so useful for educational data are „Support Vector Machines“, „Genetic Algorithms“ and „Neural Networks“.
For educational data there are „step regression“ (for binary decisions like will the student drop out y/n via linear regression function and rounding to 0 or 1), „logistic regression“ (for binary decisions like will the student drop out y/n via finding out the frequency of a specific value of the dependent variable, relatively conservative) , „J48/C4.5 Decision Trees“ (good in dealing with interaction effects, can handle numerical and categorical predictor variables, relatively conservative, good when the same result (drop out y/n) can be arrived in different ways), „JRip Decision Rules“ (set of if/then rules – many algorithms, decision trees created), „K* Instance-Based Classifiers“ (predicting the data point from a neighboring data point, good for very divergent data without easy patterns, you need the whole dataset) – and many other algorithms.


Week 5 Activity – Assignment: Problems and surprises

* Walk-Through
That wasn’t so easy to do, because the walk-through (which should explain the handling of the RapidMiner software) was in Flash and didn’t have a „back“ button – in my opinion, a simple pdf file would have been more helpful to get the context of the different steps. Thankfully, in the meantime we got a doc-file with the content. Another problem for me was that the software obviously expected that users would use drag&drop in order to add an operator and not „return“ like I did and which worked for some operators – but not all of them.

* External resource
The actual assignment, which was in a math tutor system, wasn’t available until you answered one question correctly. It took me a long time to find this correct answer, as I didn’t expect that I had to check the example csv file in Excel in order to compare if RapidMiner listed the correct attribute types when importing the csv. As RapidMiner identified some field attributes as binominal instead of polynominal I got a wrong result for kappa.
Finally, I had the correct answer and saw the start page of the math tutor system with a login window. I tried my edx login, but got no result as obviously it wasn’t intended that I got to this page. Not until I changed my Browser settings to accept cookies from ALL 3rd-parties, I saw the first question. These questions were hard to answer without background in statistics and I was relieved that there were some helpful infos in the discussion forum.

I answered a question regarding kappa without the field „studentid“, then about kappa without some other fields, conducted analysis with „Naive Bayes“, „W-JRip“ and got stuck with „Logistic Regression“ as my PC needed a long time to come to no result because I lost my patience after 50 minutes and stopped the process. I don’t think it was intended to last for such a long time and therefore tried a different approach with a subset in the operator „Nominal to Numerical“ which  didn’t work either. As the questions in the math tutor are not numbered, I don’t know exactly where I am at the moment (somewhere in the middle I think – going back is not possible and going forward is not possible until I give the correct answer).

Also frustrating was that in my opinion one question included a double negative and I thought for some time if I should say yes for fields to exclude or say yes for fields to include – My choice was nearly 100 % wrong (so maybe my answers weren’t so wrong at all…).

I have to admit, that I would have stopped working for the MOOC if this topic would habe been in week 1… What I got out of this week is that predictions are very difficult even with software which does a lot of the job. When you don’t understand what you are doing, you are getting very wrong results – therefore a deeper engagement with statistics is required. At the beginning of the week, I nearly didn’t understand anything, but after my practice in RapidMiner I have the feeling, that in some examples I actually understood what I was doing and that’s enough for me at the moment.


* Working with RapidMiner to get the kappa and therefore access to the Math Tutor assignment

Meanwhile I’m very good in the steps which are necessary to get the kappa with W-J48 because I had a lot of attempts until I got it right…. I’ll never forget binominal and polynominal… So, maybe this 720p video helps somebody who is still trying. And on a foggy November weekend with a heavy bad cold (therefore no audio), I had time for this 🙂

Learning Analytics MOOC – Week 4 – SNA Case Studies

Upon the recommendation of a friend, this week, I read the book „The Circle“ from Dave Eggers, which had quite an effect on me – especially when taking a MOOC with the topic SNA at the same time… Therefore and because I had a heavy workload in my job, I postponed engaging with DALMOOC from the evenings to this weekend. I was really interested in this week’s hangouts and watched the recordings (http://www.youtube.com/watch?v=GUUaP39VpLI and http://www.youtube.com/watch?v=ziM0EvN9n0o) which were fascinating and brought to my attention the level of „that we as participants are object of study as well“. Personally, I find it a little bit scary that my social media and learning activity is under such scrutiny. Certainly I knew before the course that it would be the case – learning analytics naturally means monitoring and drawing conclusions – but it’s different when it’s for real. However, at this moment, I don’t know yet enough of what is possible via Learning Analytics and what is commonly in use. Maybe it’s inevitable and in five years or so it will be quite normal, but I think we as educators really have to think about which tools we are using and how we do that – We have to be very, very careful with our learner data at our universities.

SNA Case Studies
This week, we got an insight in some SNA case studies and the educational constructs which were used (e.g. learning design, sense of community, creative potential, social presence, academic performance, distributed MOOC pedagogy). Thankfully the full text was available and I’ll keep these examples in mind for further reading later on. SNA can help to detect patterns of interactions in online learning environments and instructors could start intervening depending on the intended learning design (e.g. from an instructor-centered network to an „equal distribution of student distributions“). Sense of community means to which extent learners feel that they belong to a community and on the other hand benefit from participating in the community (getting information, getting feedback, also relevant for student retention in universities). The aspects creative potential („network brokers are associated with achievement and creativity“), social presence („teaching presence facilitates the development of network centrality by guiding students to establish social presence“) and academic performance („those students who were central in cross-class networks had best academic performance“) were also covered in studies, but I just watched the intro-videos.
In order to learn more about cMOOCs (where social media is an integral part), this article about Twitter use in CCK11 (socio-technical approach: nodes are persons and hashtags) is very interesting: http://www.sfu.ca/~dgasevic/papers_shared/bjet2014_cmoocs.pdf

Unfortunately I don’t have the time for further experiments with Gephi (which I would really have liked to do because I value that we are doing something concrete with tools) and week 5 with different topics is near.

Learning Analytics MOOC – Week 3 – SNA

My goal with these blog posts is to summarize and reflect a little bit about things/content I’ve learned – my blog seems to be a good way to keep this for later on after the MOOC.

Week 3 is about an introduction to Social Network Analysis (SNA) and insights how social processes unfold. „SNA aims to understand the determinants, structure, and consequences of relationships between actors“ (Source http://www.lifescied.org/content/13/2/167.full.pdf+html) SNA is multidisciplinary (not only sociology and statistics) and main analysis methods are density, centrality and modularity types of analysis. We’ll do some analysis with test data and again visualization, this time with Gephi. The interesting thing will be what’s the use of SNA for learning (I’m not there yet).

Networks consist of actors (=nodes) and relationships/connections which can represent friendship, advice, hindrance, communication. In a spreadsheet nodes and relationships would be represented in rows (and weight via adding as many rows). Data can be collected by self-reports, interviews, collection from social networks (who is following whom on Twitter etc.) and special tools which collect data from LMS (activity in online discussion boards,..) and later on be analyzed in tools like Gephi. As these networks are seldom static, you have to decide on a time frame when collecting data. Also important: Anonymizing data, obtaining consent (which may lead to incomplete networks), ethics


Network Measures

In my understanding this very informative YouTube video from Dragan Gasevic http://www.youtube.com/watch?v=Gq-4ErYLuLA  lists network measures as follows:

a) Measures which are measuring the entire network:

* Diameter = „a measure which is determining the longest distance between any pair of two nodes in the network“

* Density = „is determining the potential of the entire network to talk to each other“ (how many connections of all the possible connections are actually happening)

b) Measures which are measuring the potential of individual nodes in a network:

* Concept of Centrality: (The meaning of centrality is dependent on the kind of different metric which is used)

** Degree centrality =  A very often used measure which „indicates the total number of connections for each actor in a network“

*** In-Degree centrality = Pointing to an actor / „how many other nodes are directly trying to establish communication or are talking  to a particular node“  (popularity, prestige)

*** Out-Degree centrality = Pointing away from an actor / „outgoing connections, may mean how many emails someone sent, generosity in conversations with others“  (gregariousness)

** Betweenness centrality = „measure which indicates the ease of connection with anybody else in the network but in particular to try to connect all these potentially small subclusters of the nodes“ (network broker)

** Closeness centrality = „used to measure the ease or the shortest distance of a node to anybody else in the network (indicates how quickly you can get to anybody else in the network, not useful for networks with many actors with no ties or groups with no connection to other groups)“

It also can be interesting to think about network modularity, e.g. smaller subgroups that are closely connected to each other (modules=communities). It is relevant for later use of modularity algorithms to identify the „giant component“ and use it as a filter.


About Gephi
Installation was easy but when I played around with the test data we were given, I even didn’t find the function to zoom in so I watched this YouTube video which was very helpful to get an overview of how to use Gephi (17 min very well spent): http://youtu.be/L0C_D68E1Q0

As I haven’t done anything like this before, I reduced my tests with the example blog dataset of week 6 to the „Average Degree“ and tried to find something useful. My results are in the attached pdf-file: w3-gephi-2

I’m looking forward to week 4 – maybe the Hangout times of day will be a little bit more convenient for Middle Europe again. And I still have to try Bazaar (I really want to do that), but again, this week, I had no time for that.